AED 135M+ savings realised over three years in a multi-year pharmaceutical RFP programme for a leading UAE healthcare group

A Multi-Year Pharmaceutical RFP Programme for a Leading UAE Healthcare Group

How a repeatable, data-driven RFP and negotiation cycle secured competitive supplier deals and over AED 135M in realised savings.

Client Leading UAE healthcare group operating a network of hospitals, clinics and pharmacies.
Engagement Recurring pharmaceutical strategic sourcing: data analysis, item-level RFP, negotiation, savings assessment, implementation support and compliance tracking.
Approach A nine-step process run phase by phase, with the in-scope formulary reviewed and refreshed at the start of every phase.
Data foundation Purchase (GRN) and consumption data for the same evaluation period, cleaned and mapped to a single item view.
Relationship A partnership of more than six years, spanning spend analysis, strategic sourcing, compliance tracking, item master optimisation, inventory analysis and patient-level costing.
Status Three years of savings tracking in place, with the cycle continuing phase by phase.
incremental projected savings across the three most recent phases
~AED 0 M
projected savings tracked over three years
~AED 0 M
realised savings over the same period
AED 0 M+
savings compliance, from the first tracking year to the third
57% to 0 %

Executive Summary

A leading UAE healthcare group buys pharmaceuticals across a network of hospitals, clinics and pharmacies. Spend was fragmented, clinicians preferred different brands for the same drugs, and the group needed two things: competitive supplier terms, and a credible way to prove the savings afterwards.

EmpoweringCPO runs this as a repeatable programme rather than a one-off project. In each phase, purchase (GRN) and consumption data are combined to select the in-scope formulary. An item-level RFP follows, then evaluation, negotiation, landed-cost comparison, supplier selection and product tiering, savings assessment, approvals and implementation. After implementation, compliance with the negotiated deals is tracked.

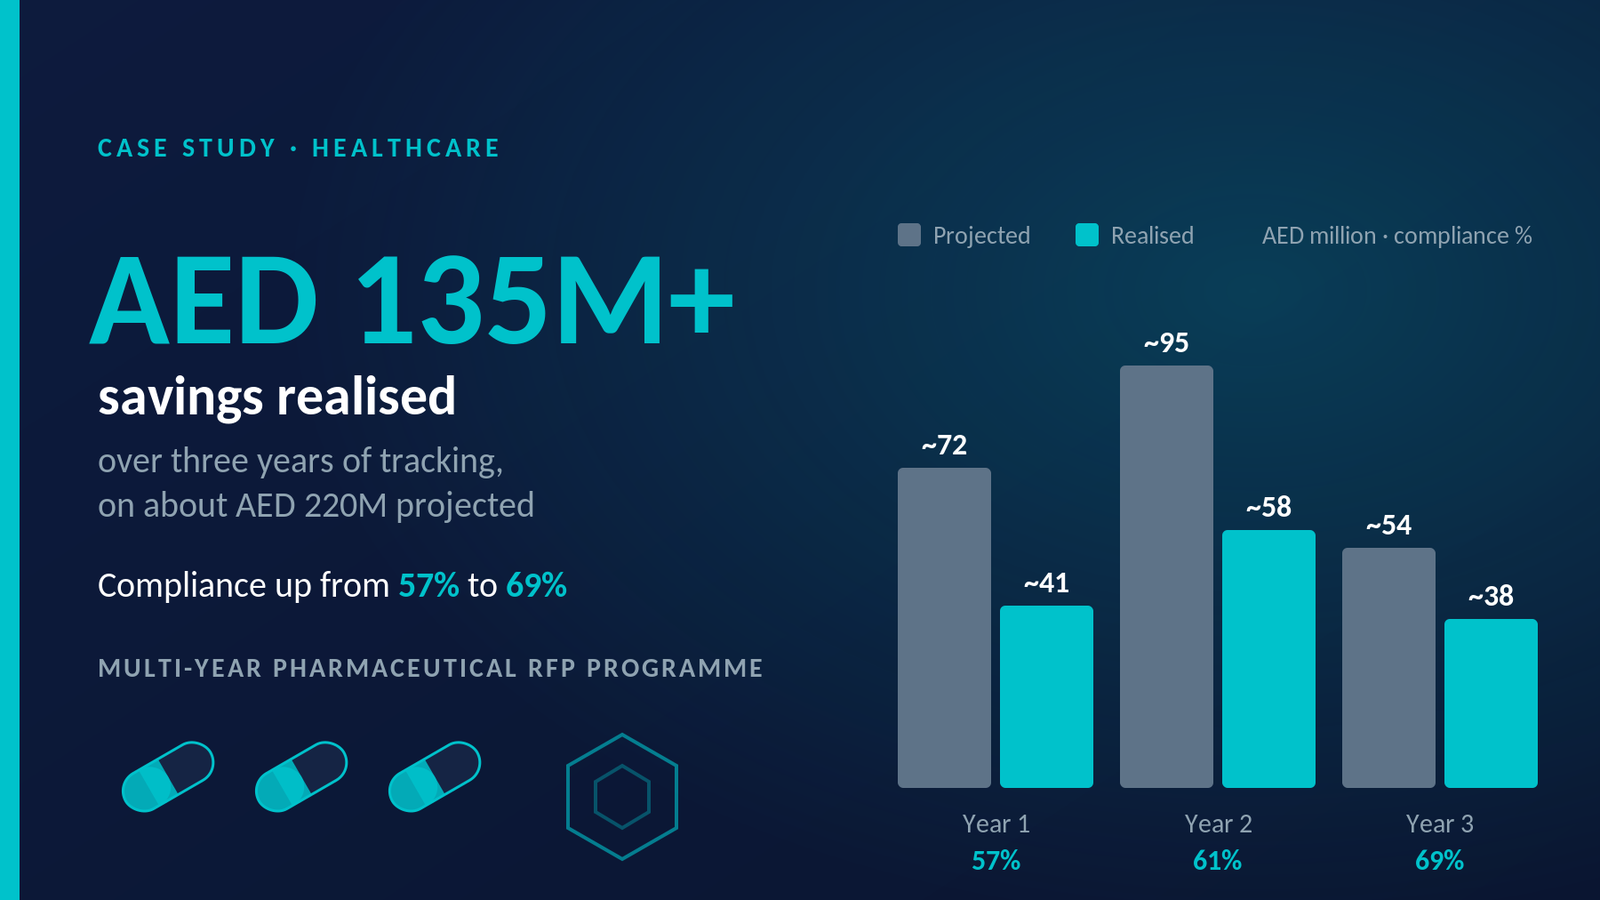
The three most recent phases identified about AED 107M of incremental projected savings. Across three years of tracking, about AED 220M of savings was projected and more than AED 135M was realised, and compliance with negotiated deals rose from 57% to 69%.

1. The Challenge

Pharmaceuticals are a high-volume, high-variety category where small price differences compound quickly. The group faced a combination of structural and behavioural issues:

Challenge What it meant
Fragmented spend Pharmaceutical purchasing was decentralised across a network of hospitals, clinics and pharmacies, which weakened buying power.
Varied brand preferences Individual clinicians preferred different brands for the same drug, so volume was split across many products and suppliers.
Price competitiveness There was no structured, item-level competition between suppliers, so pricing, discounts and rebates were not being tested.
Proof of savings Savings agreed at the table only count if they are bought in practice, so compliance with negotiated deals had to be measured.
A repeating need Contracts, prices and product ranges change, so sourcing had to be a recurring cycle rather than a one-off project.

2. Our Approach

The programme follows nine steps, repeated phase by phase. At the start of each phase the in-scope formulary is reviewed and updated, so the cycle keeps pace with changes in purchasing, consumption and the supplier market.

Step Stage What happens
01 Data consolidation and analysis GRN and consumption data are collected for the same evaluation period, then cleaned, standardised and mapped to a consistent item dataset.
02 Formulary selection and sourcing strategy Historical purchasing and consumption patterns identify the pharmacy items in the approved scope, and the strategy is validated with stakeholders.
03 RFP preparation and release An item-level request for proposal is prepared, eligible suppliers are confirmed and commercial request and response templates are shared.
04 Supplier response and evaluation Supplier offers are collected, queries and gaps are clarified, and product details, pricing and commercial terms are compared.
05 Negotiation and deal optimisation Suppliers are engaged to improve terms, revised offers are evaluated and landed costs are compared to find competitive deal options.
06 Supplier selection and product tiering Revised deals are assessed to identify suitable suppliers and cost-effective product options, against the selection criteria and stakeholder approval.
07 Savings assessment and validation Potential savings are estimated against the relevant baseline using the agreed methodology and the right purchasing and consumption data.
08 Approval, contracting and implementation Approvals are obtained, commercial documents are finalised and the implementation of approved deals and product tiering is coordinated.
09 Compliance and savings tracking Purchasing is monitored against the approved arrangements and savings are tracked after implementation to find further improvement.

Why two datasets

Both datasets cover the same evaluation period but answer different questions. GRN data shows what was bought; consumption data shows what was actually used. Together they give a more complete view of spend and of the true cost impact of each deal.

GRN data (purchase view) Consumption data (usage view)
What it captures Goods received through purchasing Pharmacy items actually consumed in the same period
What it shows Purchase quantities, costs and the purchasing baseline Real utilisation, rather than purchase volumes alone
How it is used Sets the baseline and the starting point for supplier comparison Assesses the cost impact of a deal based on what is really used
Using both helps make sure that sourcing decisions and savings assessments reflect the right purchasing and consumption perspectives, in line with the agreed methodology.

3. Inside the Process: Why It Is Complex

On paper, pharmaceutical sourcing looks simple: find a lower price. In practice, every line in the formulary involves data cleaning, clinical judgement, supplier competition and stakeholder approval, and a formulary has many lines. One item shows why a structured programme is needed.

Step 1: Building the formulary

Purchasing data records items as free-text descriptions, such as “Adol 500mg Tab 5’s”. Each description is broken down into its parts: the brand, the dosage, the form and the pack size. The molecule is identified from the brand, here paracetamol. The same breakdown is applied to every item description in the dataset, so that the same drug under different brands, spellings and pack sizes lands on one standard line.

Item Description as Recorded Brand Dosage Form Pack Size Molecule Identified
Adol 500mg Tab 5’s Adol 500 mg Tablet 5’s Paracetamol
The standard formulary line is therefore Paracetamol 500 mg Tablet. The brand name and pack size stay attached to the record, so brands can be compared within each line.

Step 2: Brand shifting, a worked example

With the formulary in place, the total purchase volume for each line is determined and the brand mix is examined. The aim is to move from brands preferred by individual doctors to clinically preferred brands with similar efficacy. The illustration below uses Paracetamol 500 mg Tablet. The values are illustrative.

Brand Cost per Piece Current Share of Volume Proposed Share of Volume
Brand A 1.50 30% 20%
Brand B 1.25 10% 80%
Brand C 2.50 40% –
Brand D 3.00 20% –
Weighted Average Cost 2.18 – 1.30
In this example, 60% of volume sat with the two highest-cost brands. Shifting most of it to Brand B lowers the weighted average cost per piece by about 40%. The answer also depends on the care setting. For in-patients, shifting to the lower-cost brand yields significant savings, while for outpatients a higher-margin brand can prove more profitable. This is one item with a wide price gap; across the whole formulary, brand shifting delivered 6% to 8%.

Why it needs a programme, not a spreadsheet

  • Clinical equivalence. Moving volume is only safe between brands with similar clinical efficacy, so each line needs clinical validation.
  • Care setting. In-patient and outpatient use can call for different brand decisions on the same drug.
  • Clinician preferences. Individual doctors prefer different brands for the same drug, so change needs evidence and a committee that can persuade peers.
  • Supplier competition. Item-level RFPs invite suppliers to compete for brand share, and negotiation then targets bonuses, rebates and landed cost.
  • Compliance tracking. Prescribed brands are monitored against suggested brands, with weekly non-compliance reports that pinpoint where practice deviates.

Multiply this by every line in the formulary, and repeat it each phase, and the scale of the work becomes clear.

What the first two phases delivered

Stage What it involves Savings
Brand shifting Consolidating the formulary and moving volume from individually preferred brands to clinically preferred brands with similar efficacy. 6% to 8%
RFP, negotiation and compliance Competitive bidding to win brand share, negotiation of bonuses and rebates, committee approval, and weekly compliance tracking. 5% to 10% additional
Overall Spend consolidation and standardisation across the category. 12% to 15%

4. Results

Savings identified in each phase

Each phase carries forward unresolved opportunities and adds new ones. The three most recent phases identified about AED 107M of incremental projected savings.

Phase Incremental projected savings (AED M) Source of opportunity
Phase 3 ~16 New opportunities
Phase 4 ~31 Carried-forward and new opportunities
Phase 5 ~60 Carried-forward and new opportunities
Total, three phases ~107
Bar chart of incremental projected savings by phase: about AED 16M in Phase 3, AED 31M in Phase 4 and AED 60M in Phase 5, about AED 107M in total
Incremental projected savings by phase, AED million.

From projected to realised

Savings only matter once they are realised. Each year, purchasing is tracked against the approved arrangements and compared with the savings that were projected. Compliance is the share of projected savings that was realised.
Tracking year Projected savings (AED M) Realised savings (AED M) Compliance
Year 1 ~72 ~41 57%
Year 2 ~95 ~58 61%
Year 3 ~54 ~38 69%
Three-year total ~220 135+ ~62%
Bar chart of projected versus realised savings by tracking year: Year 1 about AED 72M and 41M, Year 2 about AED 95M and 58M, Year 3 about AED 54M and 38M, with compliance of 57%, 61% and 69%
Projected versus realised savings by tracking year, AED million.

Realised savings have grown to more than AED 135M over three years, about 62% of what was projected, and compliance has improved every year. That trend reflects better visibility and follow-through after each award, and it is the area the programme continues to work on.

5. The Value Delivered

Competitive supplier deals

Structured competition and negotiation improve pricing, discounts, rebates and other commercial terms.

Cost-effective product selection

Product-level comparison supports informed supplier and product choices within the approved formulary.

Evidence-based savings assessment

Purchasing and consumption data support a consistent view of potential and realised savings.

Compliance and performance visibility

Post-implementation monitoring shows adherence to negotiated deals and where to improve.

6. In the Client’s Words

“EmpoweringCPO has consistently demonstrated expertise and dedication across various procurement projects. Their team exhibits professionalism, responsiveness, and unwavering commitment. Their clear communication and collaborative approach make them a pleasure to work with. EmpoweringCPO has been an essential partner in our journey towards excellence.”

Assistant General Manager, Corporate Procurement, Leading UAE Healthcare Group

7. Why It Worked

Data first

Purchase and consumption data were cleaned and mapped before any sourcing decision, so every proposal and saving could be tested against real numbers.

Competition, then negotiation

Item-level RFPs created competition, and negotiation then improved pricing, discounts, rebates and terms, compared on landed cost.

A repeatable cycle

Refreshing the formulary every phase meant new and carried-forward opportunities were captured continuously.

Stakeholders on board

Scope, strategy and selection criteria were validated with stakeholders and approved before deals were implemented.

Tracking after the deal

Monitoring continued after signing, so the gap between projected and realised savings stayed visible and could be acted on.

8. What’s Next

The programme continues with a further refresh of the in-scope formulary at the start of each new phase. The focus is on lifting compliance beyond its current level and applying the same approach to other high-spend categories. To apply the same approach to your own spend, see our strategic sourcing and savings compliance tracking services, or contact us to start with one category.

Are the savings you negotiate being realised?

Start with one high-spend category. EmpoweringCPO brings the data, the RFP and negotiation process, and the tracking to prove the savings.

Client identity withheld for confidentiality. The brand example uses illustrative values. Amounts are in AED, rounded; ~ denotes approximate. Compliance is realised savings as a share of projected savings. Savings are measured against the agreed baseline and methodology.

Share this Post
A Multi-Year Pharmaceutical RFP Programme for a Leading UAE Healthcare Group

EmpoweringCPO is a team of procurement professionals, founded in 2011 and based in India. We help organisations find procurement savings through procurement consulting and run their processes for them through procurement outsourcing, under agreed SLAs.

Get A Call Back